ROC Curve and AUC
Consider the following sample classification model
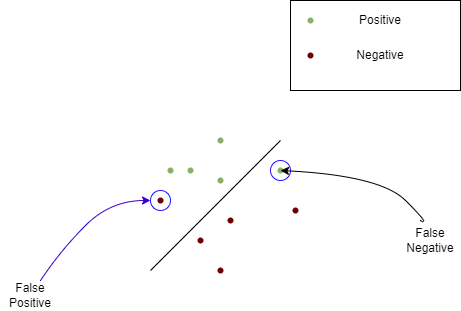
The above model is classified with few False positives and False Negatives
Think of the above model as a cancer prediction model for a moment. In that case
False positive is a healthy patient wrongly diagnosed and recommended for more tests.
False Negative is actually a cancer patient who was not diagnosed.
False negative is the worst case scenario here.
So we need to optimize the cancer detection model to make sure there are very minimal false negative scenarios.
Think of the above model as a Spam detector model for a moment. In that case
False Positive is a good email sent to a spam folder.
False Negative is a spam email sent to inbox.
This is different from the cancer deduction model. I may be fine with occasional spam mails in my inbox but I should not miss any important mail.
So a spam detector model should be optimized for very minimal False positives.
ROC curve
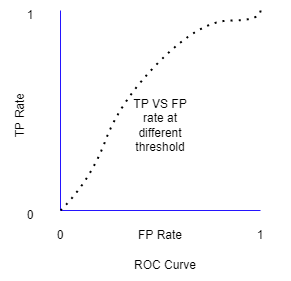
ROC curve is used to evaluate the performance of a classification model. It shows the performance of a classification model at all classification thresholds.
ROC curve plots two parameters:
- True Positive Rate
- False Positive Rate
True Positive Rate (TPR) =  TP / (TP + FN)
False Positive Rate (FPR) = FP / (FP + TN)
An ROC curve plots TPR vs FPR at different classification thresholds. Starting with all positive thresholds to all negative thresholds.
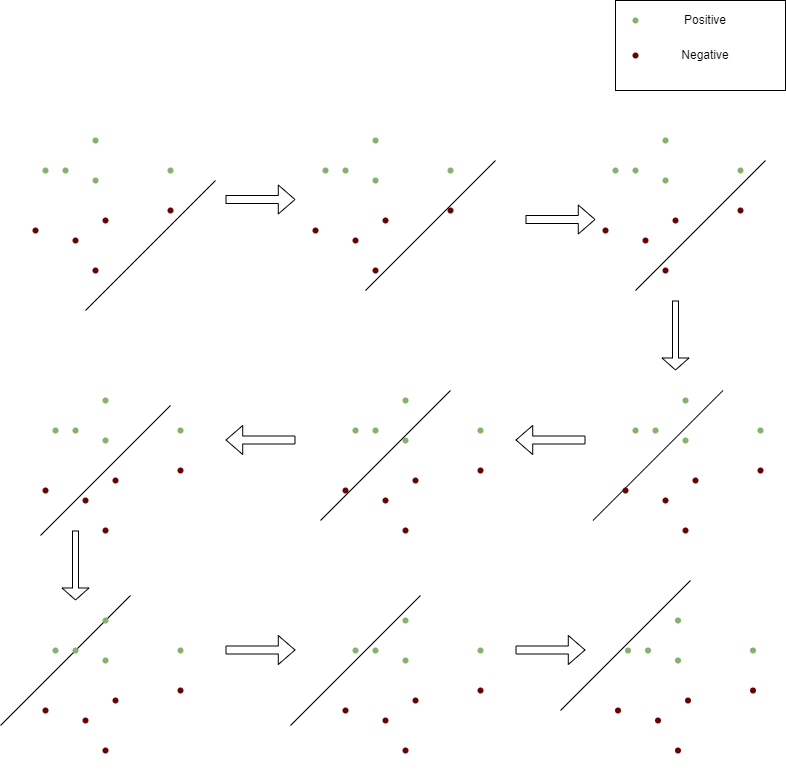
The resultant TPR vs FPR would be
AUC: Area Under the ROC Curve
The AUC measures the area underneath the entire ROC curve from (0,0) to (1,1).
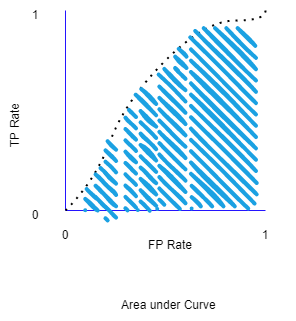
The AUC measures performance across all possible classification thresholds. The area under the ROC curve gives an idea about the benefit of using the test for the underlying question.
AUC ranges in value from 0 to 1. A model whose predictions are 100% wrong has an AUC of 0.0; one whose predictions are 100% correct has an AUC of 1.0.
References:
